Sunday, April 29, 2012

Homework Assignment 7


The semester has almost come to an end..And here comes our final assignment for the semester..We had to summarize what we learnt from BI in the final homework assignment. As usual my team was enthusiastic in doing something creative. Brainstormed a lot of ideas and finally came up with a plan of doing a skit and recording it. We decided to make a skit on two concepts – one on social media analytics and the other one depicting BI life cycle. We wanted it to be lively so we made a script with jokes here and there to add spice to our skit.


Part 1 -- The script on social media analytics was prepared by Praneeth and Dan. They explain how social media data is important and what BI analytics is about.


Part 2 -- This is about the BI life cycle and the script was prepared by Tarun and myself. This is a pretty longer one when compared to the first part.


I'm not going to break the suspense..watch out for the skit..!

So here is a movie poster that I designed for the skit. Hope you will enjoy it..!!  


Saturday, April 28, 2012

GOMC 2012


Ha...finally got back home at 5 30 pm after a long day starting at 5 30 am...But we came home with a “Cash Prize” which made our day. There were 12 teams which were scheduled to present 3 in a slot. The first team “ Honey Badgers” opened the show with their amazing presentation of clearly explaining how they tracked their conversions and results. Their client made an impressive statement about the team’s work which made the entire team feel proud of their contribution to the non-profit organization. Judges were impressed, audience were happy and my heart was beating faster. Next came our “desi” team whose client was our very own desi restaurant Kababeque located at University Blvd. The team’s result inspite of many hurdles like – management change on the client side was applaud able. They handled the Q&A really well and now my heart was in my mouth. What is going to happen to us ?! How are we going to justify our results ?! I kept instructing my co-team members to prepare for all possible questions. Six teams finished their presentations and it was lunch break. I grabbed something quick and gobbled down my throat and ran to have a practice of the presentation with my team members. Two of them had gone to take printouts of the slides. Fumbled a bit, missed out some points and stammered at places – during my practice session. Oh What am I going to do during the presentation. The clocked ticked 12 50 pm and our presentation was scheduled at 1: 00 pm. We ran to the presentation hall. But where are the two guys who went to take the print outs? It was 12 55 pm ..still they hadn’t turned up. Just two minutes before the presentation they came running into the hall with panting for breath. The show started. I introduced my client..spoke about our objective ..how we formulated the strategy ..then handed it over to my co-presenter. I could see  the judges smiling..ha..there was a sigh of relief on my face...We handled the Q&A also pretty well and went back to our seats..Five more teams presented and now it was the time for results. The judges were impressed with our batch’s performance and described about the winning teams before they gave away the prizes. Some comments and some description felt very similar to our presentation... I exchanged looks with my team members..”Are they talking about us?”..And when they called our team”Big Red” we were astonished and went running to the dice to receive the prize..My entire team was on cloud nine and we realized..”Hardwork always pays”..      

Balanced Score Card


Balanced scorecard is used by organisations to align business activities to the vision and strategy of the organisation. This is a kind of performance monitor that tracks the organisations performance against strategic goals. The balanced scorecard approach is to give a clarification to their vision and provide them with prescription to balance up in areas where they are lacking. This process allows the organisation to collect feedbacks in order to improve in their performance and hence their results.

Kaplan and Norton describe the innovation of the balanced scorecard as follows:

"The balanced scorecard retains traditional financial measures. But financial measures tell the story of past events, an adequate story for industrial age companies for which investments in long-term capabilities and customer relationships were not critical for success. These financial measures are inadequate, however, for guiding and evaluating the journey that information age companies must make to create future value through investment in customers, suppliers, employees, processes, technology, and innovation."


The balanced score suggests that any organisation should be assessed from four perspectives.


1.     Learning and growth perspective :
     This involves training and corporate cultural attitudes related to both individual and corporate self-improvement. Knowledge repository is a great asset to a company. Continuous training activities should be held in order to be with the technology trends. According to Kaplan it involves “learning” more than “training”.

2.    Customer perspective:
Customer satisfaction and customer focus are the key indicators for a “good” running business. If there is a high churn rate of customers then it is evident that there is some malfunctionining happening from the suppliers’ side or maybe we are not offering products of high quality. This might cause further decline in profits of the company.

3.    Internal Business Processes perspective:
This mainly concerns with the conformance of the business processes with the customer requirements. The metrics for measuring this should be carefully developed by inhouse subject matter experts and cannot be leased out to consultants.

4.    Financial perspective:
     Sources of funding, cost benefit analysis and risk assessment all falls under this perspective. Company’s continuous funding and profit indicators shows that the company’s performance. However the company should also evaluate its projects in order to justify its funding. This is the reason why they go in for cost benefit analysis. Financial support is what makes a company functioning healthily.

Sunday, April 22, 2012

Homework Assignment 6


It was a very interesting and a stress-buster assignment ...!!Haven't done anything like this for the past 10 years ( after my 8th grade drawing classes).. I guess everyone will accept my statement. When the assignment was announced I sat down with a pen and paper to list down my thoughts and ideas about it. Scribbled a lot..Crossed out ideas..tore the paper..!! Finally came up with two ideas – Creating a Facebook page for my resume and a BI dashboard. I wanted it to be both interactive and static. That is the reason why I had decided to do 2 resumes.

My facebook page has a cover photo of my BI dashboard and list downs my skills,achievements and degrees in a timeline format( Thanks to FB for introducing “Timeline”..made my work a little easy!!)
Here is a snapshot of my facebook page:

Drill down view of BI dashboard:
And here is the link to the dashboard

Really enjoyed doing this assignment..!


Monday, April 16, 2012

Dimensional Modelling

Dimensional modelling , a very important technique for designing data marts. It makes use of two types of tables- facts and dimensions. A fact table consists of “measures of a subject that is modelled for analysis” says Kimball. The fact tables are usually thin and long. Dimensions carry the descriptive attributes related to the subject mentioned in the fact table. The dimension tables are fat and short.

This kind of modelling makes the database very simple and understandable. Dimensional databases can be conceived as a database cube of three or four dimensions where anyone can access a slice of the database along anyone of its dimensions.

Example:

Considering a simple business which sells products in different locations and one would like to evaluate the performance of sales in a particular location over a period of time , it becomes very handy when you have modelled your database in a “cube” format. This would have time, products and location as the dimensions. The intersections of the cube will correspond to a particular measure describing a combination of product, location and time.

There are two types of dimensional model:
Star schema :  The name describes the structure of the model because it looks like a star with one central table around which a set of other tables are displayed. The central table is the fact and the surrounding tables are the dimensions.
Snowflakes schema : It is similar to start schema except for the fact that the dimensions are normalized into multiple related tables. The dimension tables are elaborate, having multiple levels of relationships and the child table has multiple parent tables.

OLAP vs OLTP


OLTP refers to the processing of operational databases. Updating, querying and inserting are performed on real time data.

OLAP refers to the general activity of querying and presenting. This mainly encompasses the act of presenting data from data warehouses and datamarts.It is a great decision support tool.


Usually organisations store the data in two different places and in different representations – one is for operation purposes (inventory monitoring or financial transaction record keeping) and the other one is for analyzing trends or patterns on the databases.And the operational databases can retrieve results faster when compared to analytical queries.


OLAP is built from OLTP databases except for the fact that OLAP has its own model so that it facilitates better understanding of the business problem at a broader perspective. The process of extracting the data from operational databases and transforming it into an analytical model that suits the business question and loading it on to the datamarts is called as ETL process.


Thursday, March 15, 2012


Keywords..!

This blog is all about the various kinds of keywords that can be made use in Google Adwords.


 Exact Keywords : These keywords are mentioned within square brackets. Your adword will pop up only if the searcher’s keywords exactly match with yours. Your ad wouldn’t pop up even if there is a change in the order of the words.


 Phrase Keywords : These are keywords are mentioned within quotation marks. If these keywords match with the user’s keywords in the exact same order then your ad might pop up. For example if your keyword is “story book” and the user types “alice in wonderland story book”, then your ad will pop up.


 Broad Match keywords : These are keywords which might allow your adword to pop-up even if there are slight variations(with respect to your keyword) in the keyword searched by the user. For example if someone is searching for “books in Tucson” and you have set “notebooks” as your broad match keyword for your adword , even then your ad would pop up. And this is the default option provided by google adword.


 Negative keywords : These keywords are used to drive irrelevant traffic out of the website. So these keywords are usually tagged with ‘-used’. 

Wednesday, March 14, 2012


Social Networking Analysis

We the “tech-savvy” are dwelling in the world of Web 2.0 and are already on the verge of evolution into Web 3.0. The major factor that contributed to Web 2.0 is social networking – the influence of “people” connections on internet. Facebook is inevitably the major player, but not the first one. Sixdegrees.com launched in 1997 was the first to implement this concept. But this triggered off many online forums and chat rooms which became the sensation of the past decade. Any teenager not on facebook is literally considered to be “anti-social” or a “boring” person...!! It looks like a “really cool” stuff where I can find my second grade friend on facebook but there is a lot more than this. There are a lot of companies out there who try to analyze our networks and find some meaning out of it.

“Social network Analysis” is indeed not as fanciful or glamorous as you see. It involves a lot of calculations. It is the measuring of relationships between people or groups. A node in a network can represent a single person, a group, a tweet, hastag or a community. Edges are the connections between the nodes. The edges can be directed or undirected. For example in twitter you can know who is following whom, so it is a directed network. Apart from this there are “zillion” other terms that reveals different truths about the network. Following are a few question which would help you understand the terms.

Who is the hub for the network?
Degree centrality would give the answer for this question. It measures the most number of direct connections made by a particular node. The degree centrality of the network would be the node which has the maximum degree centrality. That node is the most active, that person is connected to every other person on the network.

Who can access all the other nodes more quickly?           
Closeness centrality of a node tells whether it can access all other nodes quickly or not. The closeness centrality of a network has the shortest paths to every other node in the network.  So the information can spread quickly through this node.

Who can act as a mediator in the network?
Betweeness Centrality gives the probability of a node occurring between any two nodes. So “he” is the person whom you can find between any two your friends.

Who is the most influential person in the network?
Eigen vector weighs every connection that a node has and the eigenvector centrality gives the weighted sum of all connections (direct as well as undirected). The person having the highest eigen vector is the most famous person in the network. 

Tuesday, March 13, 2012


Longtail keywords and definitions for Google ad words

Deciding on keywords is the most time consuming part of the Google adword marketing challenge. You need to think from the searchers perspective – a lot of mental work is involved. I’m pretty sure that “Long tail” keywords originated from the concept of long-tail – finding a market for obscure product. These keywords are usually 3 to 5 words long are rarely been used. But we need to flip the coin and look at the advantageous part of it. These keywords come for a lesser CPC. So you can more audience by having more number of long tail keywords. This is another marketing strategy..!
Example of some long tail keywords are: “ information security courses in Arizona”
There are a couple of terms that we would have to analyze in order to check the effectiveness of our adword. Following are a couple of them:

Avg CPC(Cost per Click): This is a simple average operation performed on the total no of clicks that your ad has received.
Total actual CPC / No of clicks

Actual CPC : The cost that you pay for each click on your ad and it can be lesser than  the maximum bid that you have set for the keyword. You will be charged only the amount will allow you to beat the adrank of your adword.

CTR – Click through Rate : This is a ratio of no of clicks to the number of impressions that your ad makes on the search result page. It is very important in deciding how well you have chosen the keywords and how effective is your bidding strategy

Impressions: Every time your ad shows up on the search result page it is counted as one impression.

Quality score: Every adword has a quality score which is determined by the potential of your keyword to trigger your adword.

Adrank: This is the value assigned to your adword based on quality score. Your adrank determines the ad position.

Sunday, March 11, 2012


Wanna advertise online..Here you go..!


How does Google make money? If anyone of you have thought about it you would definitely know that Google makes its revenue from the online advertisement that we see popping on to the top and right(sometimes even at the bootom also) of the google search webpage. It seems very easy for us to look as a searcher to see the various ads being displayed on the search result page. But there is more than this that goes behind these ads. There are many different types of online ads – textual ads, display ads, pop-up ads, flash ads and image ads.

But in this blog we’ll be focussing only on textual ads. I would say that creation of a Google ad undergoes a complete life cycle from deciding on the theme to the bidding of these ads. Every company wants to attract the users by displaying the best deals/ offers on their product. So these ads are basically designed for any special event or deal. It is not necessary that a company should have just one adword, there can be many depending on the variety of products or deals. Once you have finalized on the theme of the adword you need to work on adword design. Every adword is made of 4 lines. As you can see from the image the first line is the header followed by the display url and the content of the ad. Be specific in the ad content because this is the only way to drive the user to your website. All that I have discussed above is the easiest of constructing an adword. The most challenging part is building a bidding strategy for the adword.

Every adword can be tagged with 40 to 50 keywords. These keywords are nothing but the possible textual content that any user will be typing in the google search box that is looking for a product that is related to our adword. So you need to put yourself in the searcher’s shoes and think of all possible combinations of keywords.  It doesn’t stop there, you still have the bidding strategy left for these keywords. There are two type of bidding strategies – Manual and Automatic. In manual bidding you will have to key in the bidding amount for each keyword based on the analysis that you would have done using Keyword tool and traffic estimator. These two tools come handy in deciding the bid amount because it shows the global monthly searches. In automatic bidding the bid values will be adjusted based on the number of clicks that your ad will be receiving and the ad position.
I think I have pretty much tried to explain the Google adwords on a high level in this blog.

Sunday, February 5, 2012

Lecture 3 : Best/Better Testing


 Lecture 3:  A/B testing

Every software development cycle has got a testing phase. This is very important for any project to be successful because it is during this phase all unseen and undiscovered bugs of the software are detected. A/B testing is also very similar to other types of testing like unit, regression, functional – blackbox or whitebox testing. The name of this type of testing clearly tells any novice user that it means to pick from the two choices available A or B.

There can be various KPIs set for a website and there can be hundreds of metrics used to measure these KPIs.  A/B testing serves the same purpose of KPIs. It is used to determine the success of a website by comparing two versions of it along the same metrics. Whichever version sustains the race wins the battle. Let me further investigate into this topic : A and B are two versions or designs of a website. Usually A is the existing website and B is the newly designed one. Businesses do this to test the effectiveness of the new website. The traffic to the website is split between the two versions and the performance is measured based on the metrics you have set. Say you would like to have more people signing up for an event, you can measure it for the two versions and chose the best of it and promote that version of the website.

There are certain usual elements that are being tested using A/B testing: Headlines, Images, Price, Sign-up forms length. There are free tools available on the internet for performing this test. Google Website Optimizer is one such tool. You can use A/B testing to either test one feature (say just the Signup button) or the entire website.

I guess Google Website Optimizer tool will be handy and useful for our GOMC project.


Friday, January 27, 2012

Lecture 1: Buzziness Intelligence


And today was my first “lecture” but it did not seem to be, because of the overflowing posts and tweets that were flying since last Wednesday. As soon as I entered the class I could see a bunch of my classmates crowding near the TA table. I did not give it much of an importance because I was rather very much interested in securing a seat in the first or the second row (I usually tend to lose my concentration-(polished way of saying ”I fall asleep”) after the first half-an-hour lecture and BI is not a course where I’m supposed to do it...!). After settling down in the second row I heard Snehal calling me to ask whether I had signed the attendance sheet or not. Okaye so that long- queue was for the Attendance Sheet .(Attendance also counts for the 15%  for class participation).

Dr.Sudha Ram, my professor for MIS 587-Business Intelligence had arrived, three minutes before the clock ticked 8 o’clock. I could see her busily writing down the agenda for the class in a corner of the white board.  We settled down almost 5 minutes past 8 o’clock after everyone had signed the attendance sheet. And then my professor began her lecture with a simple question ( not really..!! ) “What is Business Intelligence?” I was trying to recollect what all I had read during the past 4 days from all the tweets and facebook posts and before I could frame my thoughts someone answered saying its “Collection of Unstructured Data”. Then I could hear people giving out random answers like “BI deals with historical data”, “BI is used for prediction”, ”BI helps identify trends”, ”BI helps gain competitive advantage for a company”..And finally the class came into a consensus after my professor summed up all the points and defined BI as “Collection,measurement,understanding,analysis and prediction using data for performance management.”

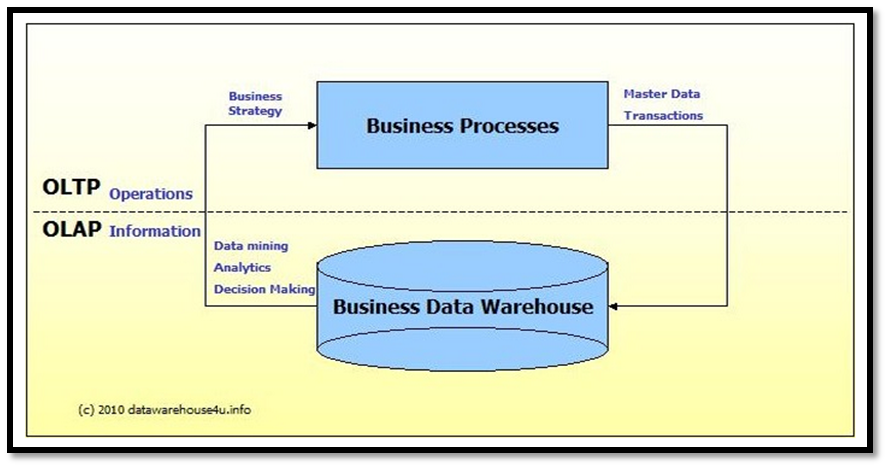
While talking about data she did stress on the differences between internal and external data. From what I understood is that Internal data is the data that is collected from the day to day operations of the business, something like the sales data of a particular product, transactional data in banks, enrolment data in school and so on. While external data is something that is gathered from forums, networking websites like facebook, twitter, blogs, etc. So for a business to predict its growth it definitely needs to analyse both these forms of data.

Someone did ask a very interesting question, “How do we rely on these data? What if people are just bluffing?” Pretty much an argumentative topic. After all its using the data from external sources we predict our business growth. So how do we trust these data? And then came the answer from our professor, that Data Profiling is the process of examining the data for its authenticity and purity.

{ My findings:  Data profiling is a method used to analyse data from data warehouses to clarify the structure, content, relationships and derivation rules of the data. The results of the analysis is used in making strategic business decisions. There are several different kinds of Data profiling techniques}

Data , Social Media and Prediction were the three constantly used words in class. I could hear it from every corner of my class. There was another intuitive question asked by one of my batch mates, “Why can’t we do all these collection, analysis and prediction using some JAVA algorithm?” Oh GOD are we going to talk about ALGOS in class now.!!  No..not now ..already there were a plenty of new terms piercing my cortex. Thankfully my professor had a simple and a straight answer to it “NO. Algorithms are a part of the techniques used in prediction or analysis of the data." 

“KPI  - Key Performance Indicator” was another important term that was under constantly probed during the class. KPIs are used for performance measurement.

And the time was 9 ‘o clock .Great !! I was pretty much awake and still listening to my class lecture. Then there were discussions on Paradigm shift and Web analytics which I’ll be discussing in my next blog. So stay tuned and frequently visit my blog until my next blog shows up.